Predicting Blood Flow Rate
Introduction
This project was carried out as a part of the **“Digital Shaper Program”* in the Summer Semester in Aachen (Summer Term 2022/23).*
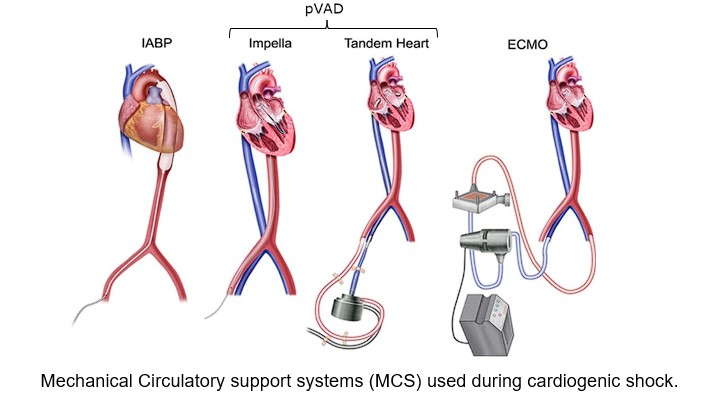
Cardiovascular diseases represent a global health crisis, claiming approximately 17.9 million lives each year and ranking as the leading cause of mortality worldwide. This category encompasses various conditions, including coronary heart disease, cerebrovascular disease, and rheumatic heart disease, all of which affect the heart and blood vessels. In our project, our primary focus lies on one of the dire consequences of these cardiovascular diseases: cardiogenic shock. Cardiogenic shock is a critical condition that occurs when the heart fails to provide sufficient oxygen-rich blood to the body, potentially leading to organ failure and, ultimately, death. Swift and decisive medical intervention in a hospital setting is imperative in such cases. In Germany alone, approximately 50,000 patients experience cardiogenic shock annually. Even with immediate medical attention aimed at restoring cardiac output, the survival rate hovers around 40%. To safeguard individuals at risk of cardiogenic shocks, there’s a pressing need for precise monitoring devices capable of assessing cardiac output and blood flow within the vessels. Our project is dedicated to the development of such a machine learning model, which leverages electrical resistance measurements at various points in the blood vessels to provide accurate and timely assessments.
Idea
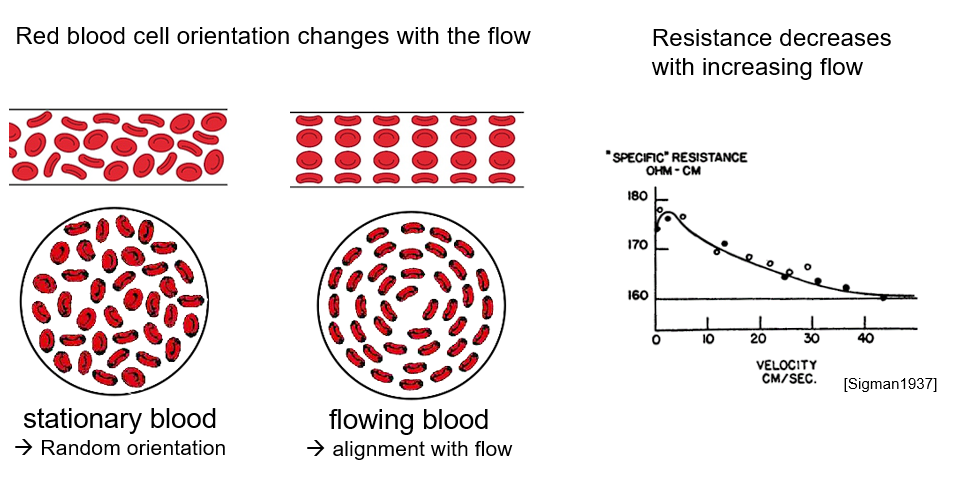
Our central concept revolves around the use of the electrical resistance of blood at specific points to accurately predict blood flow rates. In general, when blood flow is impeded or stagnant, blood cells exhibit a random alignment, which disrupts the flow of electrical current and results in elevated electrical resistance. Conversely, when the blood flow rate is high, the blood cells align themselves in the direction of flow, consequently reducing the electrical resistance of the blood. This fundamental relationship illustrates that as the flow rate within the blood vessels increases, the corresponding electrical resistance decreases, offering a reliable basis for our innovative approach.
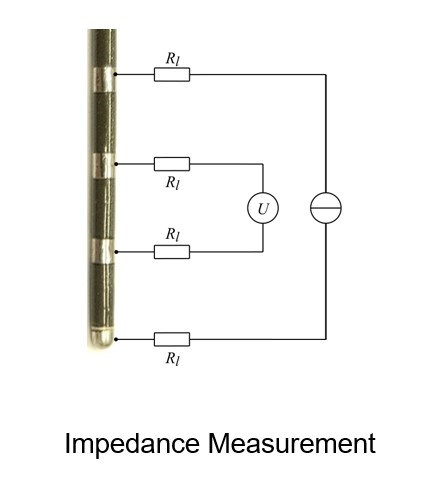
The device that we used to take the readings measures the electrical resistance at several points along a blood vessel. These values will then be used to predict the actual flow rate. Using the data that we received from our mentor we decided to train a ML model that will use supervised learning to predict the flow rate using these resistance values.
Data analysis is a critical and exploratory process that involves inspecting, cleansing, transforming, and modeling data with the goal of discovering useful information, supporting decision-making, and uncovering patterns, correlations, and insights from the data. In our project, we dived into a dataset containing numerical and potentially complex number data, and sought to conduct a thorough exploration, data cleaning, and modeling process.
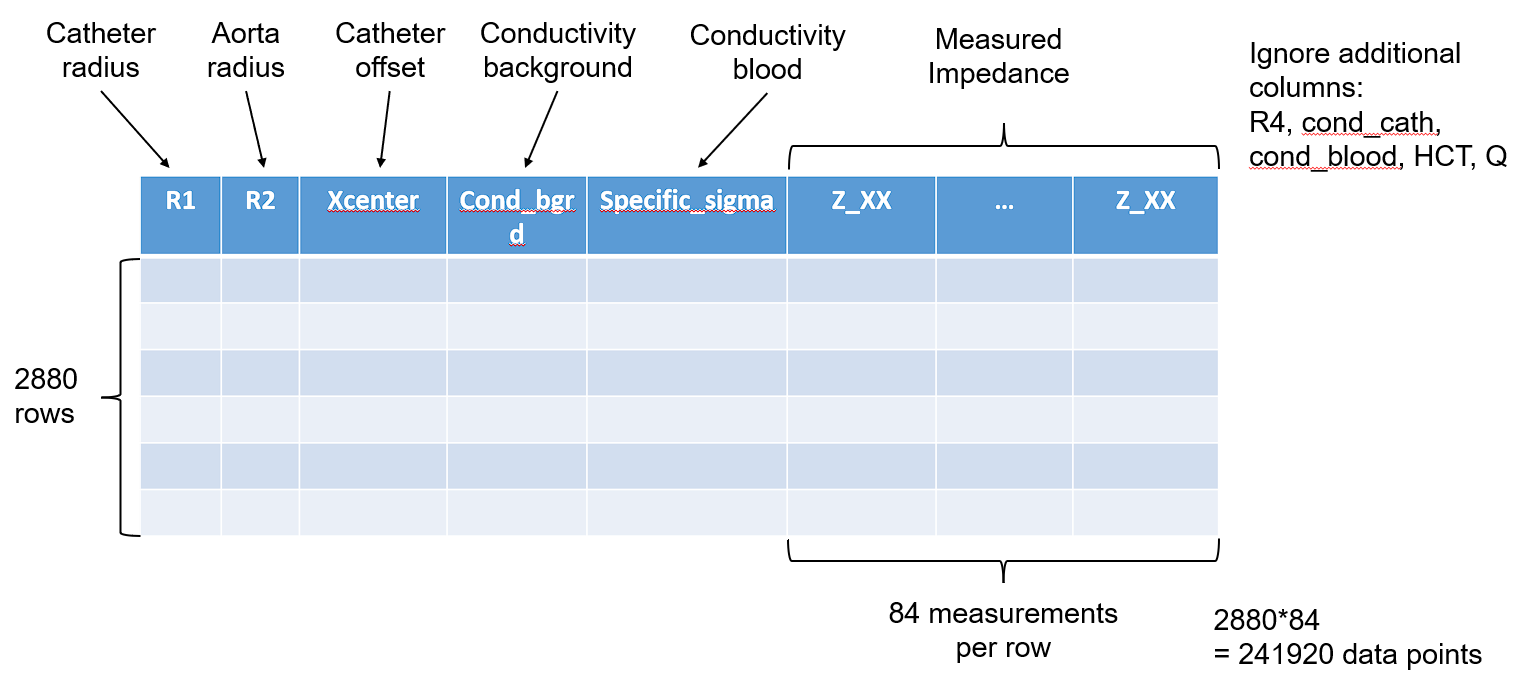
The data that we received was sample data from the Medical Institute at RWTH University. The data consisted of 89 columns and 2880 rows. Of these 89 columns i.e. features 84 of them were resistance measurements using different combinations of resistors at various points on the device.
1. Data Exploration and Data Preprocessing
Our data exploration journey commenced with the initial step of eliminating extraneous columns, resulting in a dataset featuring 84 features that contained complex impedance values, along with an additional 4 feature vectors with real values. In addition to this, we also have a target vector. To deal with this combination of complex and real values we took 2 approaches, one where we use the magnitudes of the complex values for further analysis. On the other, we split the complex values into real and imaginary parts and both are evaluated.
Case 1: Magnitude of complex values
After calculating the magnitudes of the values, our feature set now consists solely of real numbers. However, to facilitate model implementation and reduce computation time, we recognized the need to reduce the dimensionality of this dataset. To achieve this, we explored both feature selection and feature extraction methods. In our initial approach, we employed a feature selection technique. This process entails selecting specific features from the dataset without altering their values. Essentially, we identified the columns with the greatest significance for our task and trained our model using this refined dataset.
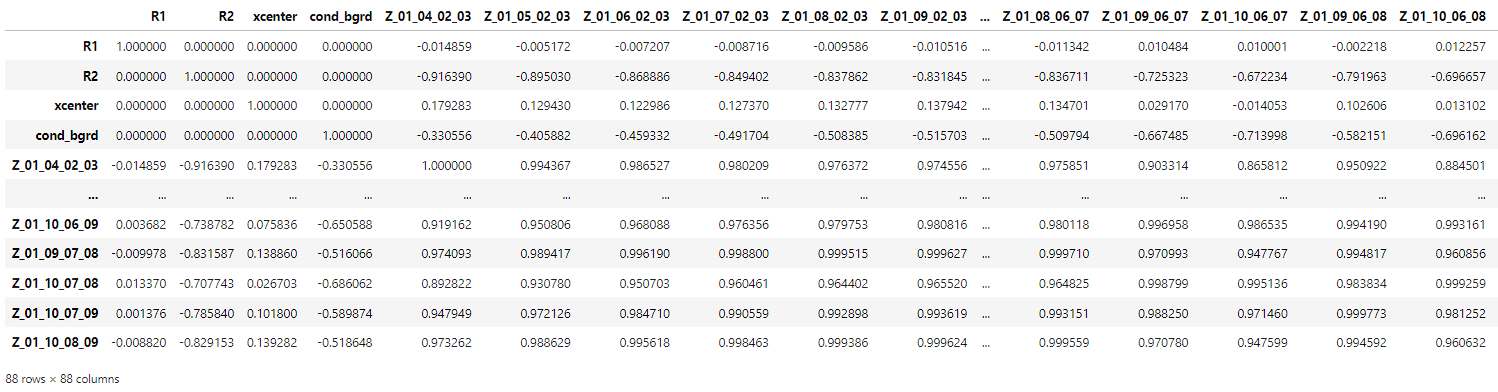
To commence the feature selection, we initially utilized the Spearmann Correlation, a method selected over Pearson due to its ability to handle non-linear relationships. Upon scrutinizing the correlation values between the different features, it became evident that numerous columns exhibited high correlations with one another. We established a correlation threshold, subsequently discarding columns with strong correlations. As a result, we narrowed down our feature set to just 21 columns.
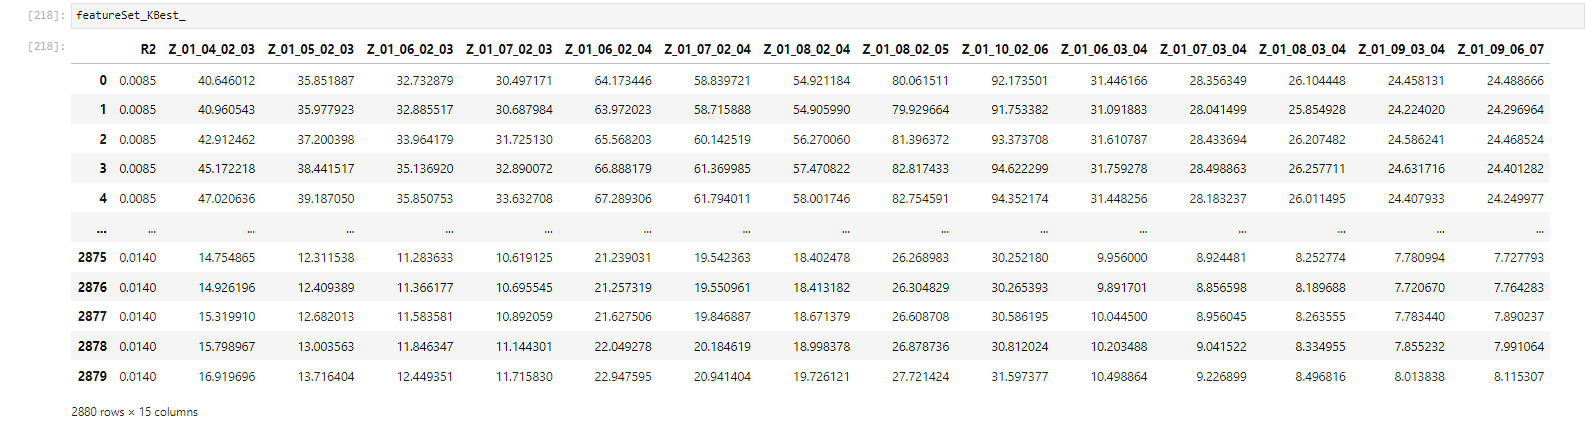
Additionally, we applied the SelectKBest function to identify features with the highest correlation to the target values. This dual approach allowed us to enhance feature selection further, refining our dataset based on its relevance to our specific task.
With these results in hand for reference, we also ventured to try out other methods.
Case 2: Real and Imaginary part split
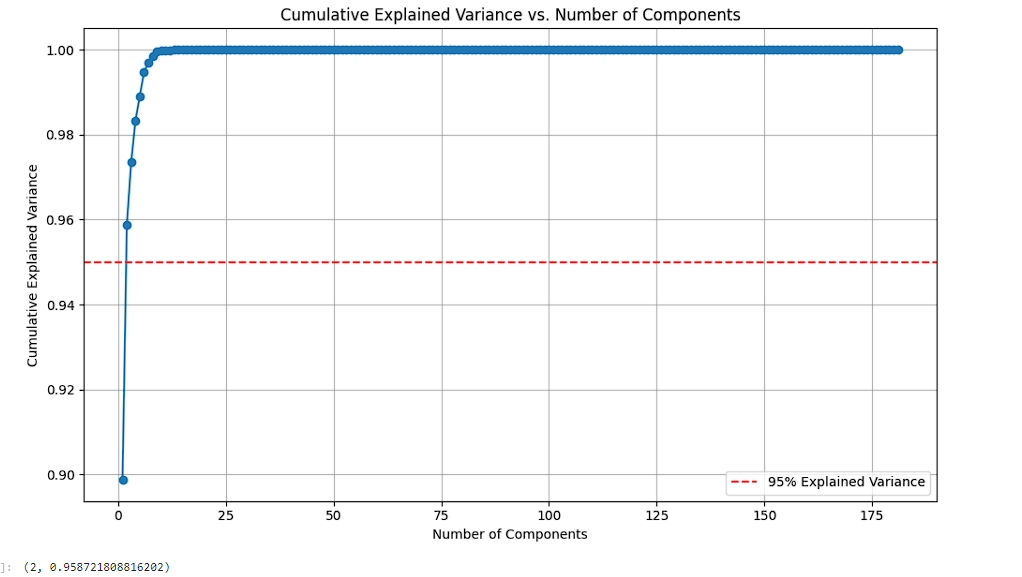
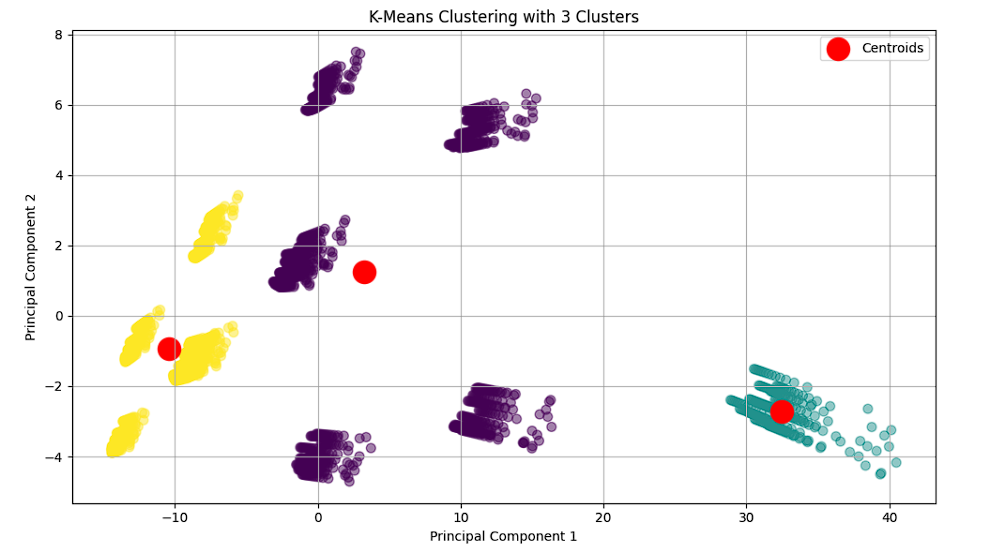
In this alternative approach, we didn’t use the magnitudes of the complex values. Instead, we split each of the impedance columns into 2 parts, one for the real and one for the imaginary value. These values were normalized, and we turned to a feature extraction method known as PCA (Principal Component Analysis). Feature extraction techniques like PCA generate new features by combining existing ones. In PCA, the new features are created in a way that prioritizes features with the highest variance, granting them the greatest importance. This approach is guided by the variance within the feature set, as it strongly influences their impact on the target values.
Method
What Methods Were Used to Solve the Problem?
- Data Exploration and Preprocessing:
- Investigated the data’s structure, identified complex numbers, and separated them into their real and imaginary parts.
- Addressed outliers through identification and handling strategies.
- Data Visualization:
- Employed various plots and charts to visualize the data, understand its distribution, and identify patterns and anomalies.
- Modeling:
- Applied machine learning models, such as K-Means Clustering and PCA, to explore inherent groupings and reduce dimensionality in the data.
What Was Your Approach?
- Complex Number Handling: Separated the real and imaginary parts of the complex numbers, treating them as separate features for analysis and modeling.
- Outlier Handling: Employed the Z-Score method to identify outliers and explored strategies like removal and transformation to mitigate their impact.
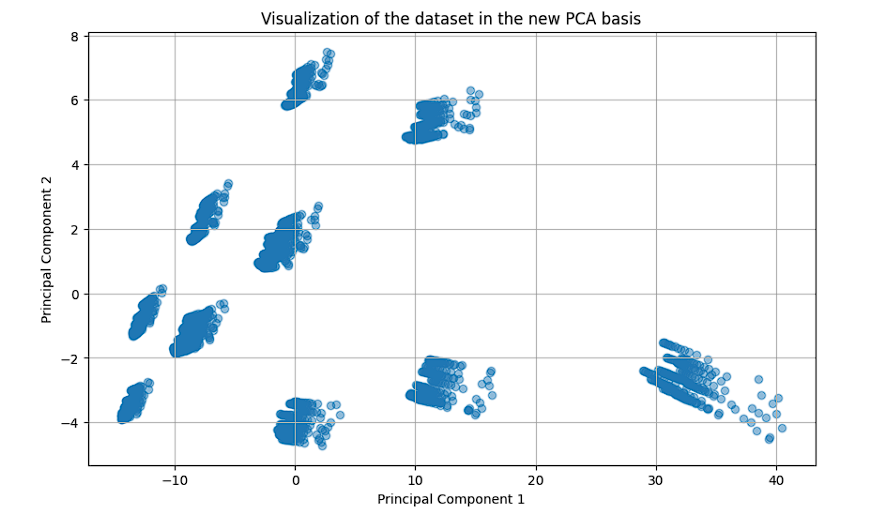
- Data Modeling: Utilized K-Means clustering to explore inherent groupings in the data and PCA for dimensionality reduction and visualization.
Project Results
Outcome
- Complex Number Decomposition: Successfully decomposed complex numbers into separate real and imaginary parts, facilitating further analysis.
- Outlier Analysis: Identified and visualized outliers, exploring their impact on the data and subsequent modeling.
- Data Modeling: Applied clustering and PCA to explore patterns, relationships, and groupings within the data.
Issues Faced During the Project
- Technical Glitches: Encountered technical issues that hindered continuous and coherent data analysis and modeling.
- Data Complexity: The presence of complex numbers and outliers necessitated careful preprocessing to ensure robust subsequent analysis.
Conclusion
What Problem Does Your Project Solve?
Problem Statement:
Handling and deriving insights from data containing complex numbers and ensuring robust data analysis and modeling by adequately addressing data quality issues, such as outliers.
Significance:
Complex numbers and outliers can significantly impact data analysis and model performance. Adequate handling and processing of such data are pivotal to ensure reliable insights and model predictions.
Through meticulous data exploration, preprocessing, and modeling, we navigated through the complexities and challenges posed by the dataset, unveiling its underlying structure, patterns, and potential insights. The decomposition of complex numbers and strategic outlier handling paved the way for robust data visualization and modeling, revealing inherent groupings and relationships within the data.
Possibilities to Improve
- Enhanced Outlier Handling: Explore alternative outlier handling strategies and assess their impact on preserving data variability and model performance.
- Additional Data Modeling: Employ a wider array of models and algorithms to explore further patterns, relationships, and insights within the data.
Future Work / Outlook
- Deep Dive into Data: Engage in a more in-depth exploration of the data to understand its underlying phenomena and potential domain-specific implications.
- Advanced Modeling: Employ advanced modeling techniques, such as deep learning, to explore the data further and possibly unveil more intricate patterns and relationships.
- Incorporate Domain Expertise: Leverage domain knowledge to enhance data preprocessing, feature engineering, and modeling to ensure the derived insights and patterns are valid, reliable, and applicable in a real-world context.
Through this project, we not only navigated through the multifaceted aspects of data analysis and modeling but also encountered and overcame various challenges, paving the way for further exploration and advanced modeling in future endeavors. The journey, layered with exploration, visualization, modeling, and continuous learning, underscored the significance and potential of robust data analysis in unveiling hidden patterns, deriving insights, and informing decision-making in diverse domains.